


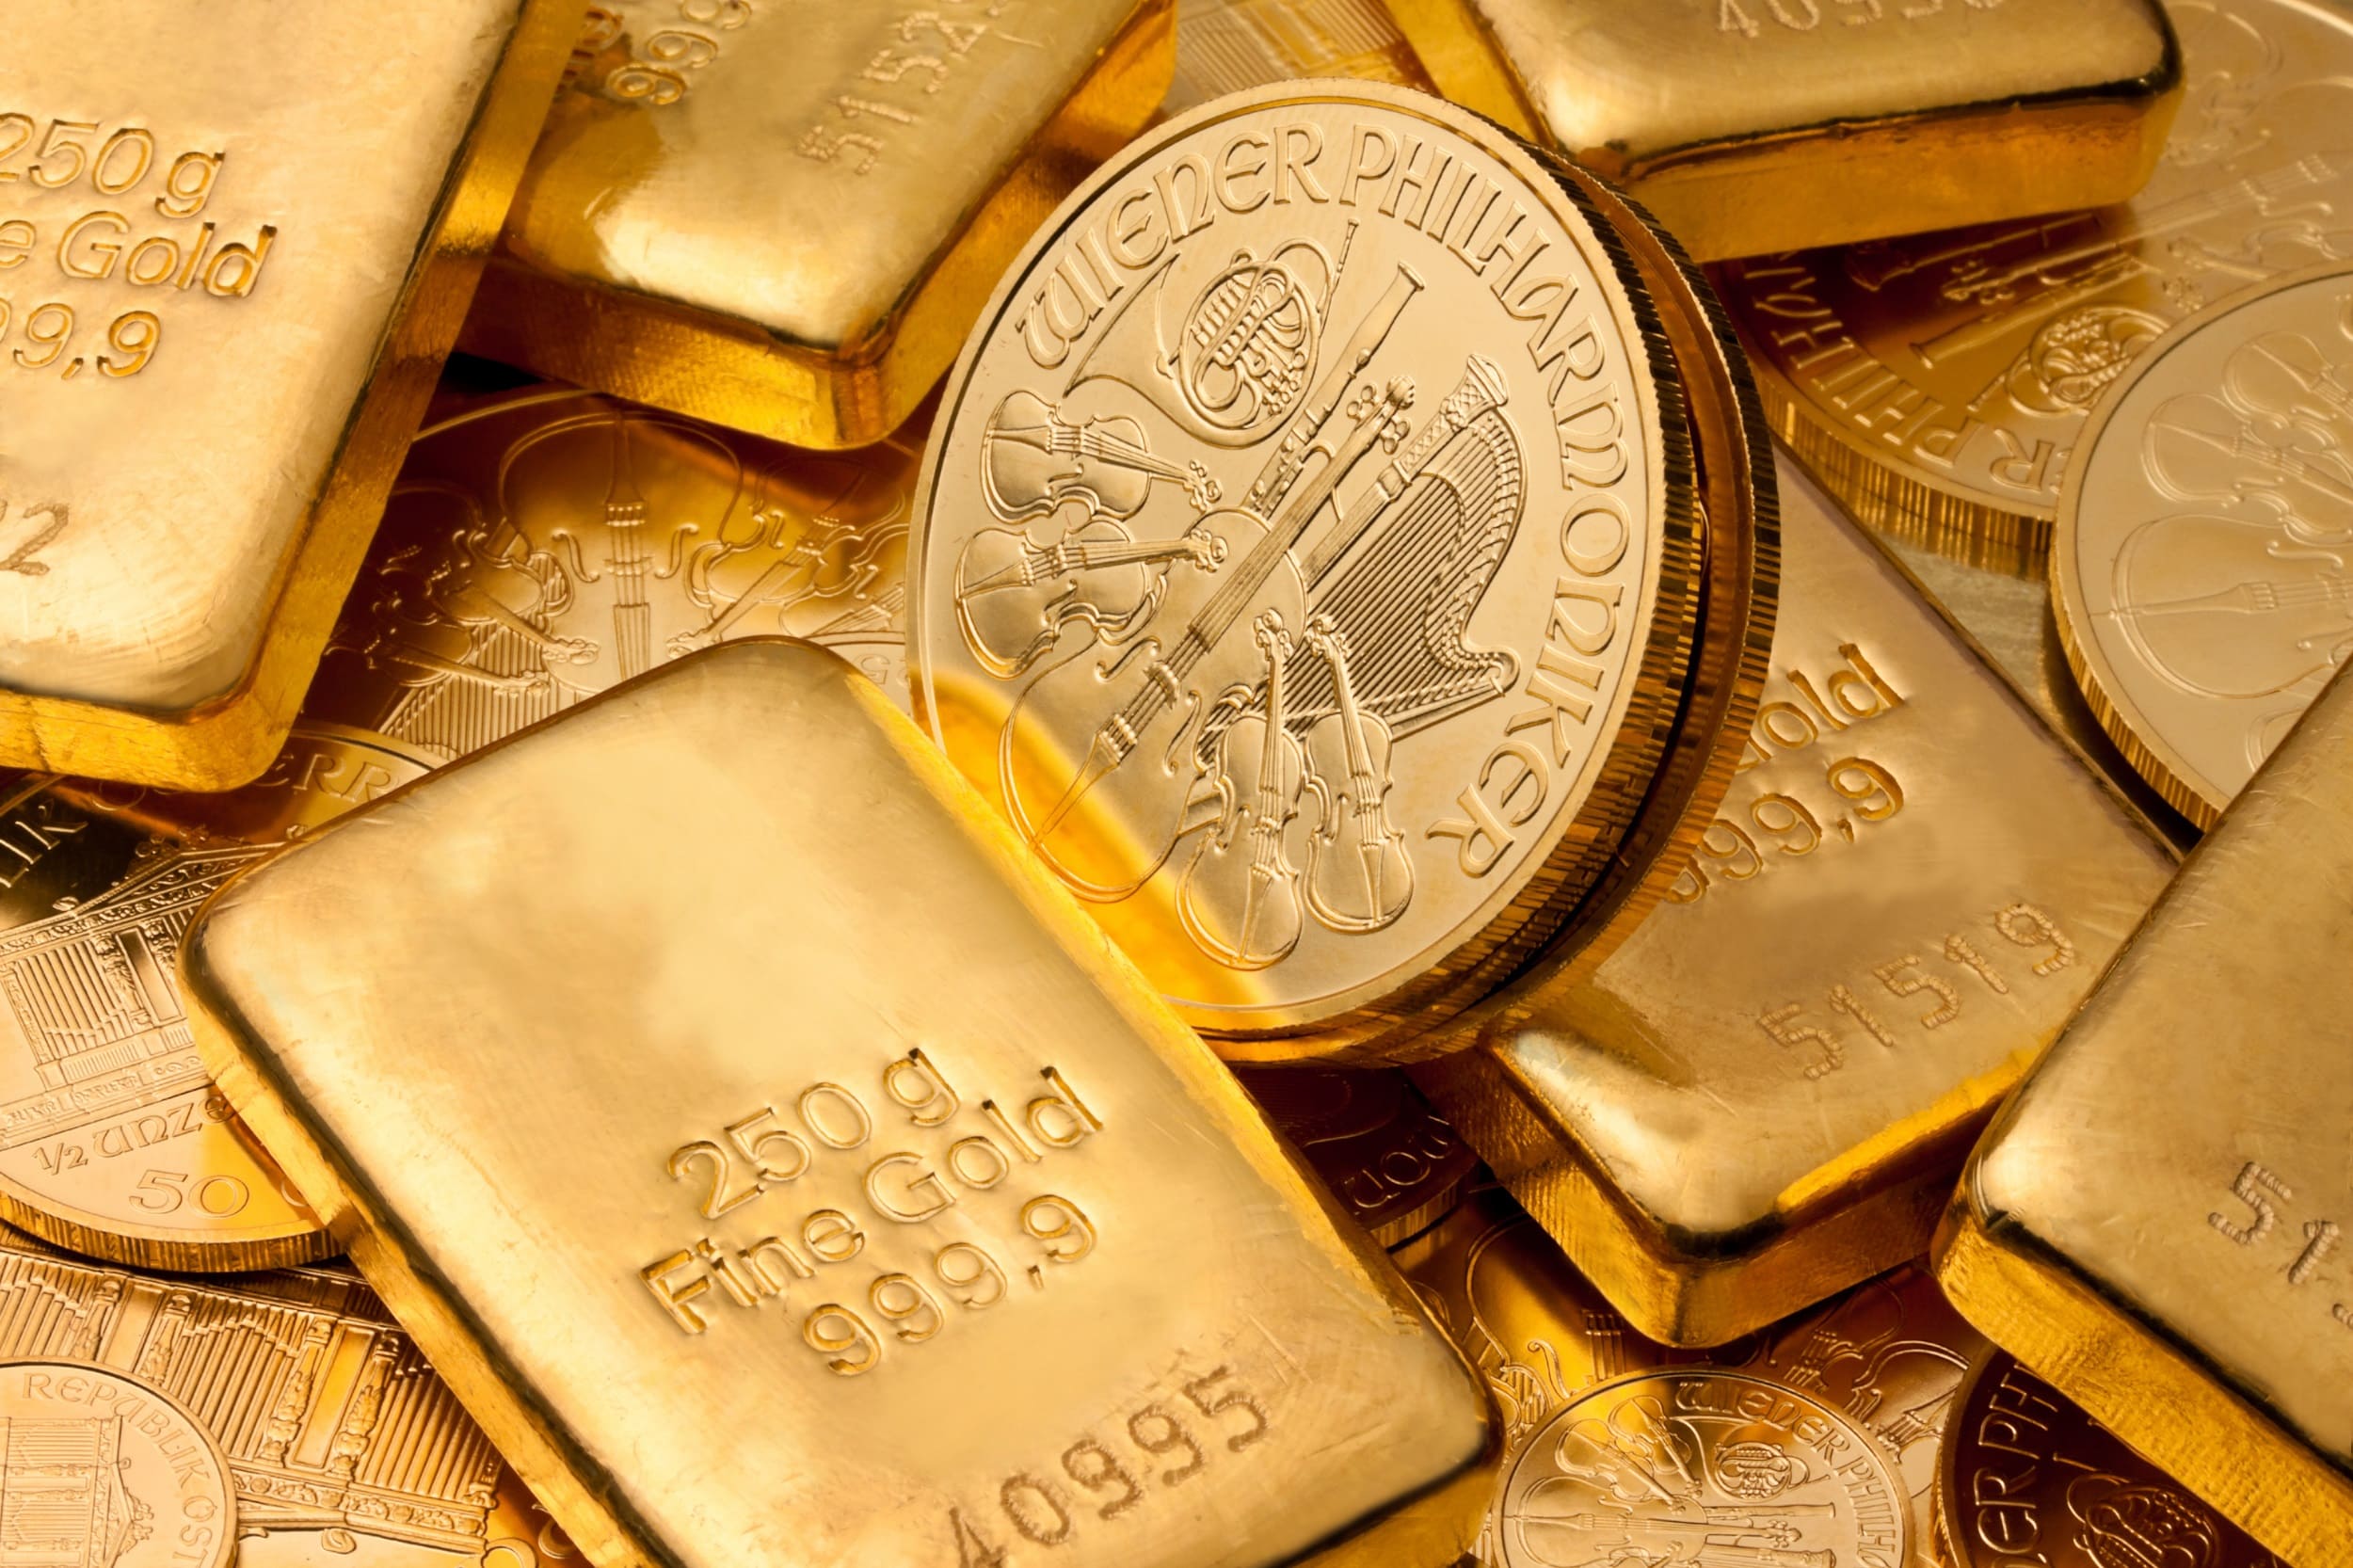
As markets reopen after the holiday period on December 29, 2025, precious metals exhibit classic year-end behavior: profit-taking in thin liquidity tempers the extraordinary 2025 rallies, while core technical supports remain intact and bullish fundamentals persist. Gold (XAUUSD) trades around $4,465–$4,478 per ounce after peaking near $4,550 earlier in December, down about 1.5% intraday but still up over 70% year-to-date—one of its strongest performances since 1979. Silver (XAGUSD) shows greater volatility, dipping over 4% to approximately $75–$76 per ounce after briefly surpassing $80, yet posting an astonishing 160%+ annual gain driven by industrial demand surges.
This in-depth analysis examines the drivers of the recent pullback, detailed technical setups, underlying fundamentals fueling the bull market, and comprehensive forecasts extending into 2026 and beyond.
Current Market Snapshot: Year-End Profit-Taking Emerges
On December 29, 2025, spot gold eased to around $4,465–$4,478, reflecting mild selling pressure after record highs exceeded $4,550 in late-December sessions. Silver retreated sharply to $75.46–$76, down 4–5% intraday following touches above $80—the first time in history—amid amplified moves in low-volume holiday trading.
This correction stems primarily from seasonal factors: traders booking substantial 2025 gains for tax and portfolio rebalancing purposes, exacerbated by reduced liquidity over the Christmas/New Year period. Despite the dips, both metals maintain structural uptrends, bolstered by ongoing safe-haven flows, central bank accumulation, and expectations for additional monetary easing in 2026.


Detailed Technical Analysis for Gold (XAUUSD)
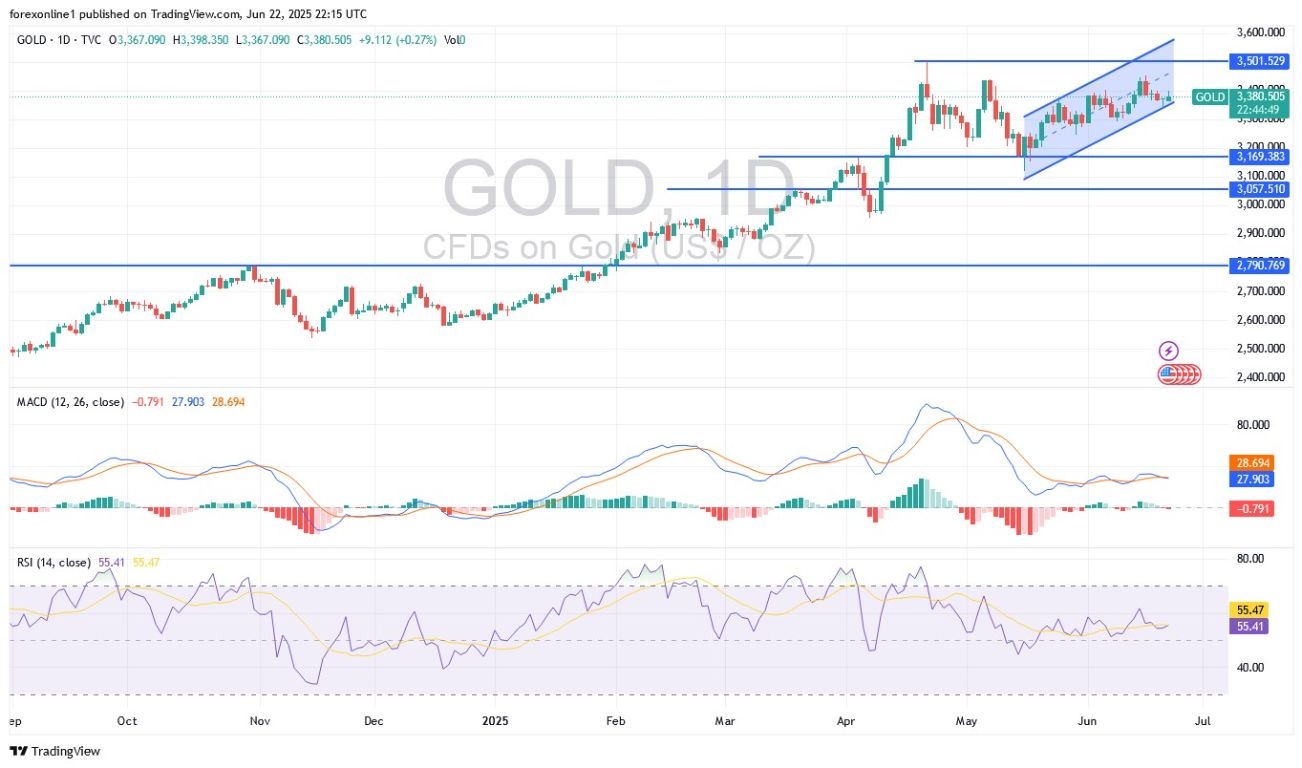
Gold’s price action remains firmly bullish on higher timeframes, trading within a multi-year ascending channel that began in late 2022. Recent facelifts in 2025 propelled multiple breakouts, with December’s push above $4,500 confirming extension phases.
Key Levels as of December 29, 2025:
- Immediate Resistance: $4,526–$4,550 (recent all-time highs), $4,576 (extended target), $4,600 (psychological barrier).
- Near-Term Support: $4,441–$4,450, $4,373–$4,380 (50-day moving average and prior breakout zone).
- Deeper Support: $4,310–$4,339 (monthly pivot), $4,185 (potential corrective target on breakdown).
Indicators show overbought conditions—RSI hovering near 70–80 on daily/weekly charts—suggesting room for consolidation or mild pullbacks. However, no bearish reversal patterns have formed; higher lows persist, and moving averages (50/200-day) align bullishly.
A decisive close above $4,576 could accelerate toward $4,700–$4,800 in early 2026. Conversely, a sustained drop below $4,435 might open deeper corrections to $4,300, though such moves are increasingly viewed as buying opportunities in the prevailing macro environment.
Detailed Technical Analysis for Silver (XAGUSD)
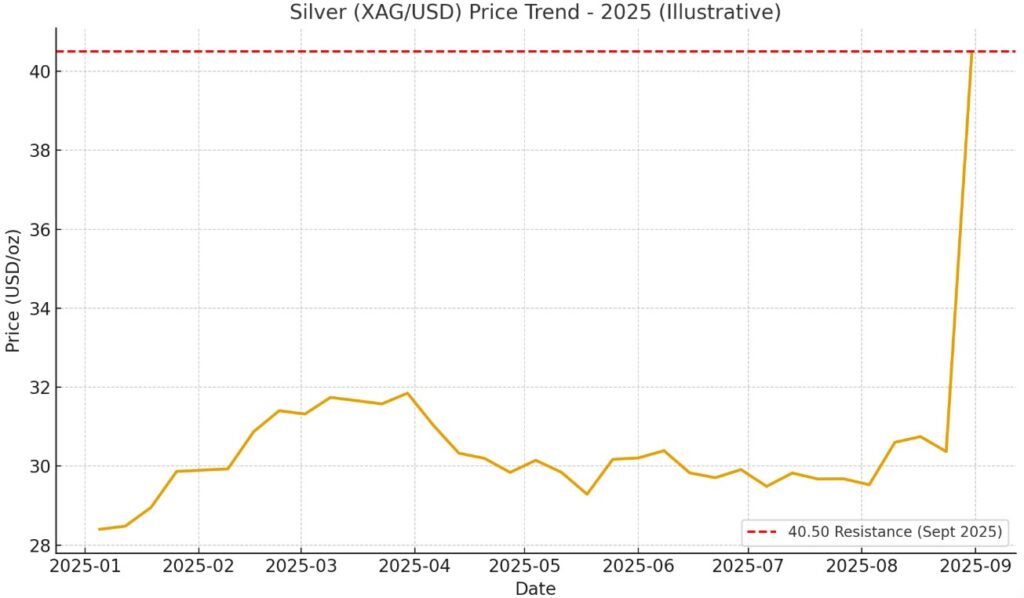
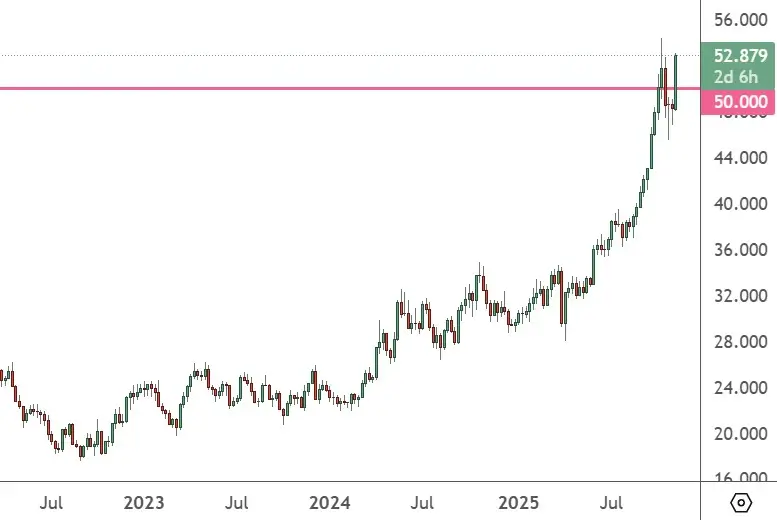
Silver’s 2025 performance has been explosive, outpacing gold due to dual monetary/industrial roles. The metal broke multi-decade resistance in mid-year, entering price discovery with vertical rallies in Q4.
Key Levels:
- Resistance: $80.25 (recent peak), $85–$90 (short-term extensions), $100 (psychological/long-term target).
- Support: $76.55 (near-term), $74.05–$71.65 (channel support and prior highs), $70 (deeper retracement).
- Indicators: RSI exceeding 80 signals extreme overbought conditions, prone to sharp volatility.
The gold-silver ratio compressing to 60–68 underscores silver’s relative outperformance. Breakouts above $80 could target $85+ rapidly, while failures below $74 might test $70. Overall, silver’s chart favors bulls on higher timeframes, with corrections likely shallow in the bull market context.
Fundamental Drivers Fueling the Historic 2025 Rally
2025 delivered a perfect storm for precious metals:
- Aggressive Monetary Easing — Multiple Federal Reserve rate cuts reduced real yields, enhancing appeal for non-yielding assets.
- Escalating Geopolitics — Conflicts in the Middle East, Russia-Ukraine, U.S.-Venezuela tensions, and strikes in Nigeria bolstered safe-haven demand.
- Record Central Bank Purchases — Over 850 tonnes of gold acquired officially, with emerging markets diversifying reserves amid de-dollarization trends.
- Robust ETF and Investor Inflows — Billions poured into gold/silver ETFs amid inflation hedging.
- U.S. Dollar Weakness — The USD index slumped ~10%, its worst year in decades.
For silver, industrial tailwinds were paramount: explosive demand from solar panels, EVs, AI data centers, and electronics created persistent supply deficits, amplified by events like short squeezes and potential export curbs from major producers.
These factors combined to drive gold’s 70%+ and silver’s 160%+ gains, marking one of the strongest precious metals bull runs in modern history.
Reasons Behind Late-December Profit-Taking
Year-end dynamics are textbook: portfolio managers lock in gains, reducing positions for reporting and tax optimization. Thin liquidity—common during holidays—magnifies swings, turning modest selling into sharper dips.
No fundamental reversal has occurred; core supports like geopolitical risks and easing expectations endure. Analysts view this as healthy consolidation within a multi-year uptrend, setting the stage for renewed momentum in 2026.
Comprehensive Gold Price Forecast for 2026 and Beyond
Consensus among major institutions is overwhelmingly bullish for gold in 2026:
- Average Projections: $4,500–$4,700 quarterly averages, with Q4 targets clustering around $4,900–$5,055.
- Bullish Outliers: J.P. Morgan ($5,055 Q4 average, $5,400 by 2027); Yardeni Research ($6,000 year-end); Bank of America/Goldman Sachs ($5,000+).
- Key Catalysts: Further rate cuts (markets pricing 2+ in 2026), sustained central bank buying (~585 tonnes quarterly), persistent geopolitics, and ETF inflows.
Downside scenarios involve rapid tension de-escalation or aggressive Fed tightening, potentially pressuring prices toward $4,300–$4,125. Long-term (2030+), structural de-dollarization and inflation hedging support projections beyond $6,000–$7,000.
Silver Price Forecast: Potential for Outsized Gains in 2026
Silver’s dual nature positions it for continued volatility and upside:
- Short-Term: Rebounds targeting $85–$90 possible in Q1 2026.
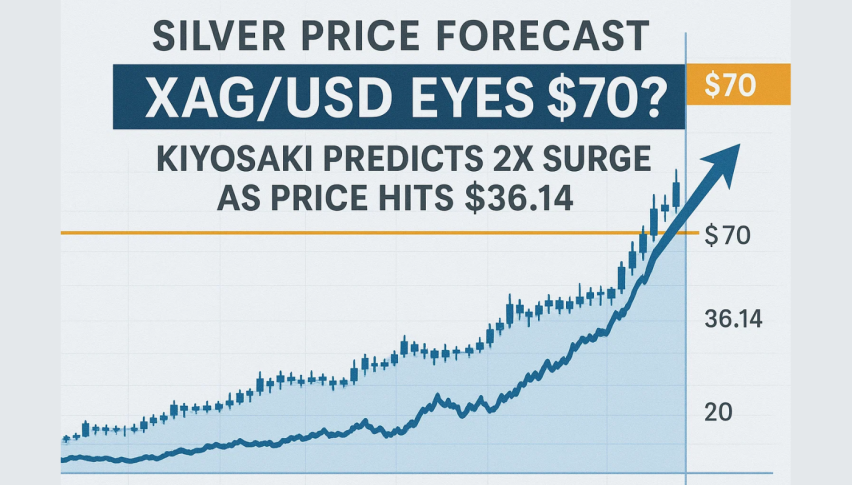
- 2026 Averages: $70–$100, with retail sentiment eyeing triple digits amid supply squeezes.
- Drivers: Industrial boom (solar/EV/AI projected >200M oz consumption), ongoing deficits, ratio compression toward historical norms.
Risks include economic slowdowns curbing industrial demand, potentially correcting to $50–$60. However, silver’s “high-beta” to gold suggests stronger percentage gains in bullish environments.
Intermarket Relationships and Broader Implications
The gold-silver ratio near 60 highlights silver’s catch-up phase, historically preceding further outperformance. Correlations with copper (industrial proxy) and broader risk assets influence flows, while inverse USD ties remain strong.
Precious metals’ surge reflects a “debasement trade”—hedging against fiscal excesses and currency weakening—evident in tandem moves with low-debt nation currencies.
Practical Investment Strategies in the Current Environment
- Dip Buying → Accumulate on pullbacks to defined supports, using ETFs (GLD/SLV) or physical for long-term holds.
- Portfolio Allocation → 5–15% in precious metals for diversification/inflation protection.
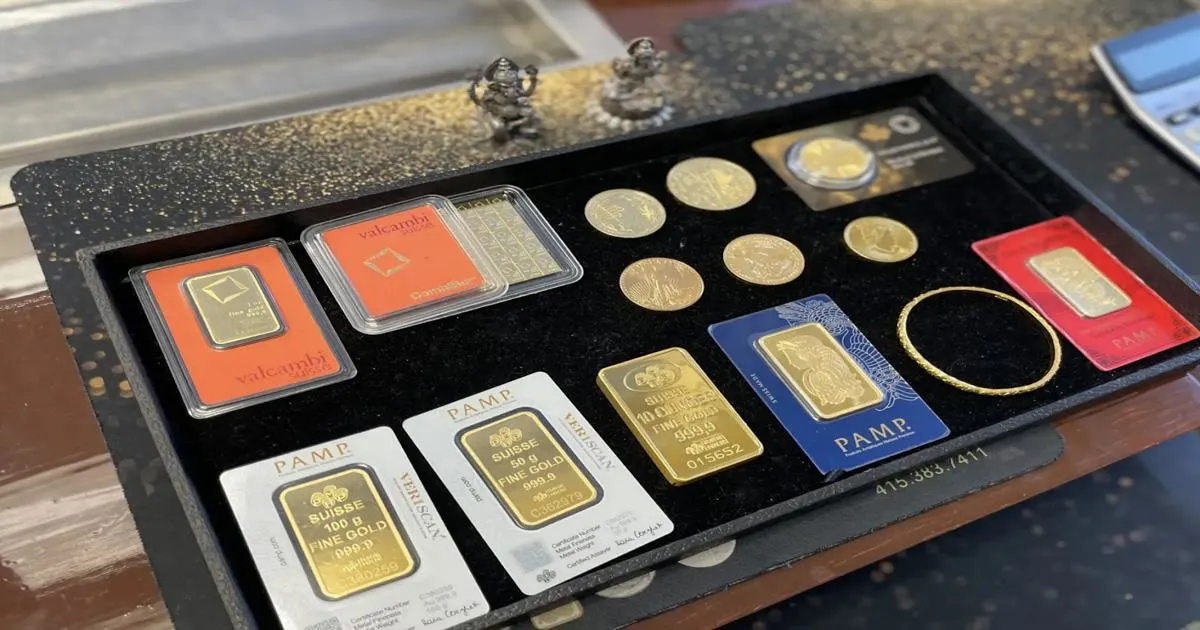
- Physical vs. Paper → Coins/bars for tangible ownership; futures/miners for leverage.
- Hedging Tactics → Options or leveraged ETFs for short-term plays, paired with stops.
Miners offer amplified exposure but higher risk.
Key Risks to the Bullish Thesis
Potential challenges include:
- Sudden geopolitical resolutions reducing safe-haven needs.
- Reaccelerating inflation prompting Fed pauses/hikes.
- Sharp USD rebound from policy shifts.
- Overextended technicals leading to prolonged corrections.
Monitoring upcoming data (FOMC minutes, jobless claims) will be crucial.
Conclusion
Late-2025 profit-taking has paused the meteoric rallies in gold and silver, but key technical levels hold firm, and no fundamental cracks have emerged. With 2025 delivering historic gains amid easing cycles, geopolitical frictions, and demand surges, the setup for 2026 appears equally supportive—potentially propelling gold toward $5,000+ and silver to $100 or beyond.Investors should treat current weakness as an accumulation window in what continues to be one of the most compelling macro trades of the decade.
